DATA: The class of 2028 in numbers
Here’s what 541 first years told the News about their backgrounds and experiences.

The class of 2028, the most selective so far, is on campus!
A News survey distributed to all members of the class of 2028 reveals that this group of students hails from a wide array of backgrounds and has diverse interests. The survey provides insights into first years’ religious identities, political affiliations and relationship statuses.
Curious about Yale’s newest students? Dive into the data to discover more about the class of 2028.
What backgrounds do Yalies come from?
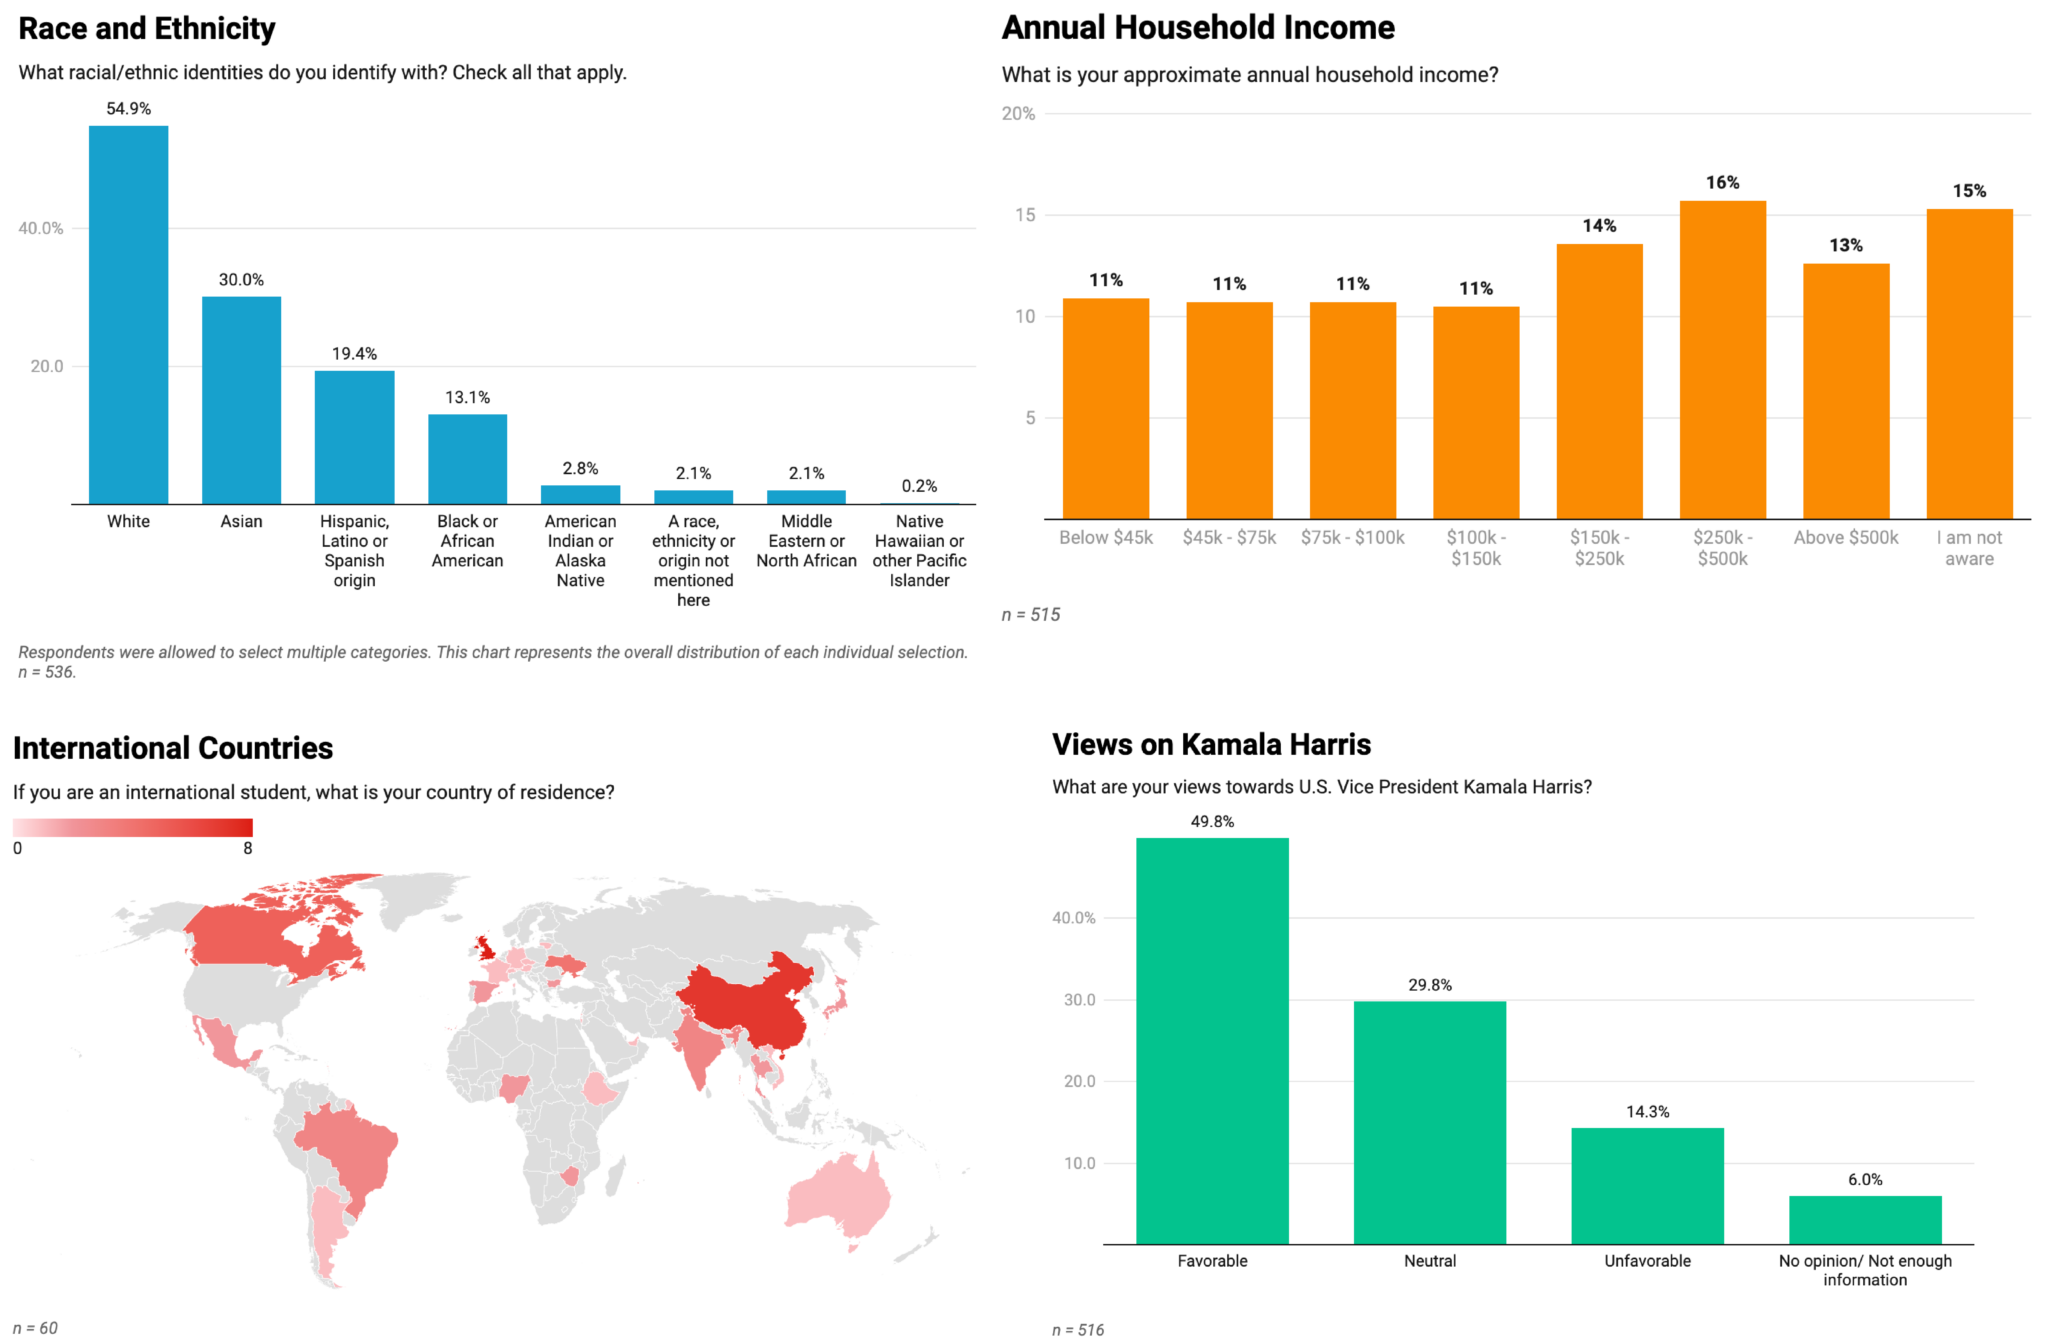
54.9 percent of 536 respondents in the class of 2028 identify as white, 30 percent as Asian, 19.4 percent as Hispanic and 13.1 percent as Black. More than 20 percent of the respondents selected more than one racial/ethnic identity.
Around 31 percent of respondents identify as not heterosexual.
9 percent indicated that they were recruited athletes and 17 percent have familial ties to Yale College or one of Yale’s graduate and professional schools.
Where do Yalies come from?
Survey respondents come from 47 states and 27 countries.
The majority of respondents — 57 percent — come from suburban residential communities. New York, California and Texas are the most common home states for students from the United States. By contrast, no respondents come from Utah, Oregon and Tennessee.
The countries that send the highest number of students to Yale, per the survey, are China, the United Kingdom, Canada and Ukraine.
Let’s talk money
Approximately 56 percent of respondents receive financial aid from Yale or external organizations like Questbridge or the Gates Foundation.
Yale’s Financial Aid Office advertises that all demonstrated financial needs of College students are met with a package that does not include loans. However, 13 percent of respondents expect to take out loans to finance their Yale education.
19 percent of responders who self-identified as middle-income students and 20 percent of those who self-identified as upper-middle-income students expect to take out loans, in contrast with only 3 percent of lower-income and 4 percent of upper-income students. This shines a light on the ongoing conversations about Yale’s affordability for middle-income students.
The median household income of responders is in the $150,000 to $250,000 annual household income range. In 2022, the median household income in the United States was $74,580.
Parents’ education
Five percent of first years currently have a family member attending Yale, and 13.9 percent have a family member who attended Yale in the past.
Among respondents, 67 percent have at least one parent with a master’s, professional or doctoral degree. Nationally, only 14.4 percent of adults aged 25 or older fall into this category.
Admissions process and after
Around half of the respondents in the class of 2028 were admitted to at least one other Ivy League, Duke University, the Massachusetts Institute of Technology or Stanford University. For 75 percent, Yale was a first-choice college, with MIT and Stanford being the other most popular options.
Currently, 46 percent of the respondents plan to pursue a different major than the major they originally applied for. Eleven percent of respondents mentioned receiving a likely letter from Yale, but only 1 percent of non-athletes received such pre-decision notification.
Yalies’ academic achievements at high school
Fifty-seven percent of respondents indicated that they graduated in the top 5 percent of their high school class, and less than 10 percent of respondents indicated that they graduated below this mark. The reason for this disparity is that 35 percent of respondents’ high schools did not rank or reveal rank to students.
Of these students, 63 percent attended public high schools, while 36 percent attended private schools. Of that group, 12 percent attended a boarding school. These responses indicate a slightly higher yield of students from public high schools in the class of 2028 than in the class of 2027, where 60 percent of students attended public high schools and 40 percent of students attended private high schools. Nationally, 10 percent of students are enrolled in private high schools.
Despite Yale being test-optional this year, more than 76 percent of the incoming class chose to submit a test score. The median SAT score for students who submitted a score was 1,550, while the median ACT score was 35. 388 first-year students shared their SAT scores in the survey.
SAT scores remained roughly the same across demographic categories. Asian student respondents represented the highest median scores at 1,560, while recruited athletes represented the lowest median score at 1,480, which is still over 400 points above the national average.
Romance and lifestyle
70 percent of the incoming class of 2028 reported being single with 17 percent of respondents having their high school relationship end because of college.
35.5 percent of 510 respondents are yet to have their first kiss.
More first years reported using marijuana than tobacco/nicotine. This aligns with the 2021 National Survey on Drug Use which found a higher percentage of young adults used marijuana than nicotine products.
60 percent of the respondents do not plan to join Greek life at Yale, and only 8.8 percent answered that they wanted to join a fraternity or sorority.
What are your views towards …?
Over 65 percent of the incoming class leans left politically, and 18.3 percent self-identified as moderates. 49.8 percent view Vice President Kamala Harris favorably, compared with 18.1 percent for Biden and only 2.3 percent for Trump.
41 percent of respondents have an unfavorable opinion of Harvard indicating that the Yale-Harvard rivalry is alive and well in the incoming class of 2028.


