


Every year, the U.S. Census Bureau releases an American Community Survey, allowing us to take a closer look at where, and how, the demographics of New Haven are changing. Building off of work done by the Urban Social Processes Workshop at Harvard and the geographer Elvin Wyly, I used the 2014 survey to take a look at some of the variables that try to capture gentrification — the process by which higher-income people buy property in neighborhoods, raising property values but displacing lower-income residents.
Generally, there are two ways to look at gentrification. Social determinants, like the proportion of residents with a college degree or a white-collar job, allow us to look at the changes in the types of people who live in each neighborhood. Economic determinants, like changes in median household income, rent and house value, can suggest displacement, as residents are forced to move due to an increase in the cost of living.
The Census Bureau divides New Haven into 28 “tracts.” For this project, I looked at the change in each tract of both social and economic determinants between 2000 and 2014, then comparing each to the average change across the entire city, creating a kind of test for gentrification.
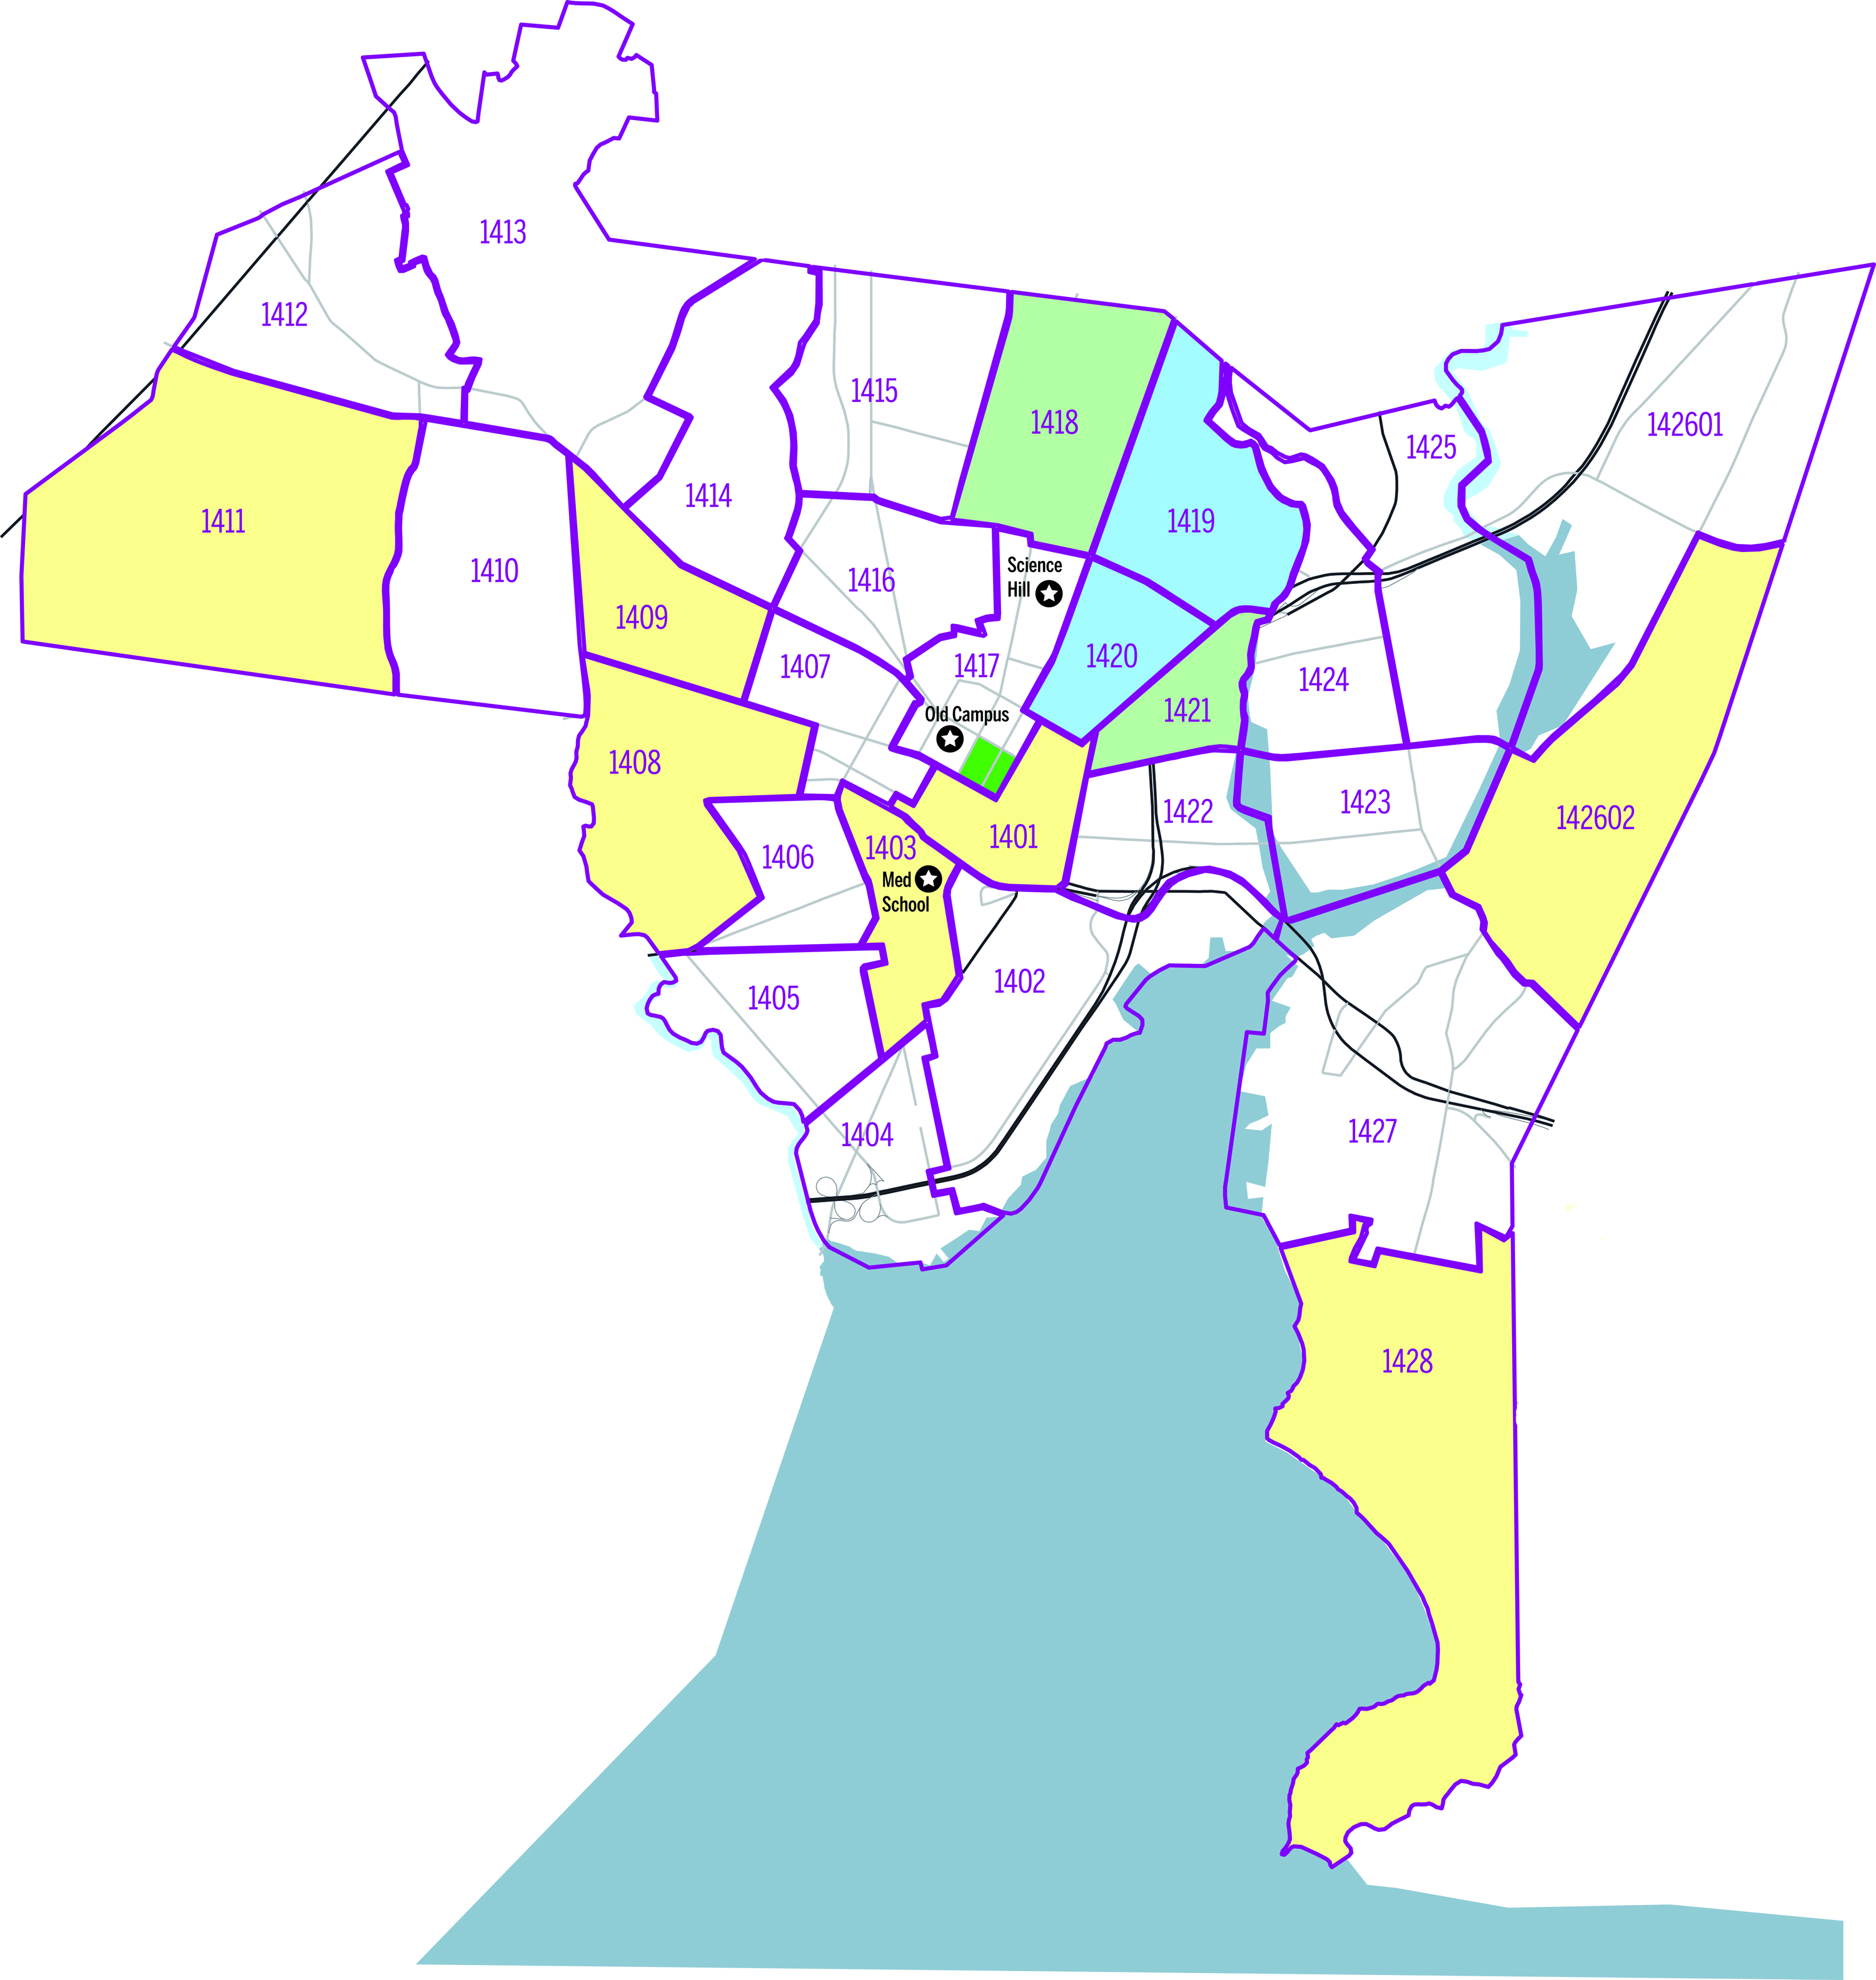
Areas where social determinants (percent of residents with college degrees and professional jobs) are increasing at least 10 percent faster than the citywide average are colored in yellow. Areas where economic determinants (median income, rent and house value) are increasing at least 10 percent faster than the citywide average are colored in blue. Areas that passed both of these tests are shown in green.
Looking at the map, we can see that the East Rock neighborhood (Tracts 1418 and 1421) shows the most evidence of a demographic shift, demonstrating a faster rise in both land value and social status than the rest of New Haven. This makes intuitive sense — as Yale expands, it’s become a more attractive place to live for Yale’s grad students and professors, who likely drive the neighborhood’s continued change.
We also see evidence of the continued emergence of professional communities. While the total number of people with professional jobs in New Haven has increased by only 1 percent, the downtown area (Tract 1401) has had its professional population increase by 20 percent since 2000 — now, 74 percent of all people who live there hold white-collar jobs. The area around the School of Medicine (Tract 1403) has seen a similarly meteoric rise, increasing its professional fraction by 13 percent since 2000 to a current value of 27 percent.
A blanket analysis like this can miss some of the nuances of gentrification. Take the case of Newhallville (Tract 1415), which isn’t colored on the map. The median household income has stayed at $31,000 since 2000, while the median monthly rent has increased by $300, at the same rate as the rest of the city. Thus, while wealthier people haven’t been moving into the district, land values have gone up. This places a clear burden on the neighborhood’s renters, who have seen their real income decrease.
There’s no perfect way to measure and define gentrification, but this analysis is a good surface look at the neighborhoods in which the face of the city has transformed most over the last decade and a half.