


The Yale baseball team approaches the beginning of Ivy League play this weekend, entering with a nonconference record of 8–10. However, record alone only says so much about the Bulldogs’ performance thus far.
A team could go 8–10 with its victories coming largely in blowouts and its losses coming in one-run and extra-inning games. When looking to evaluate a team’s true level of talent, many analysts prefer to look at the scores of games rather than just a team’s record.
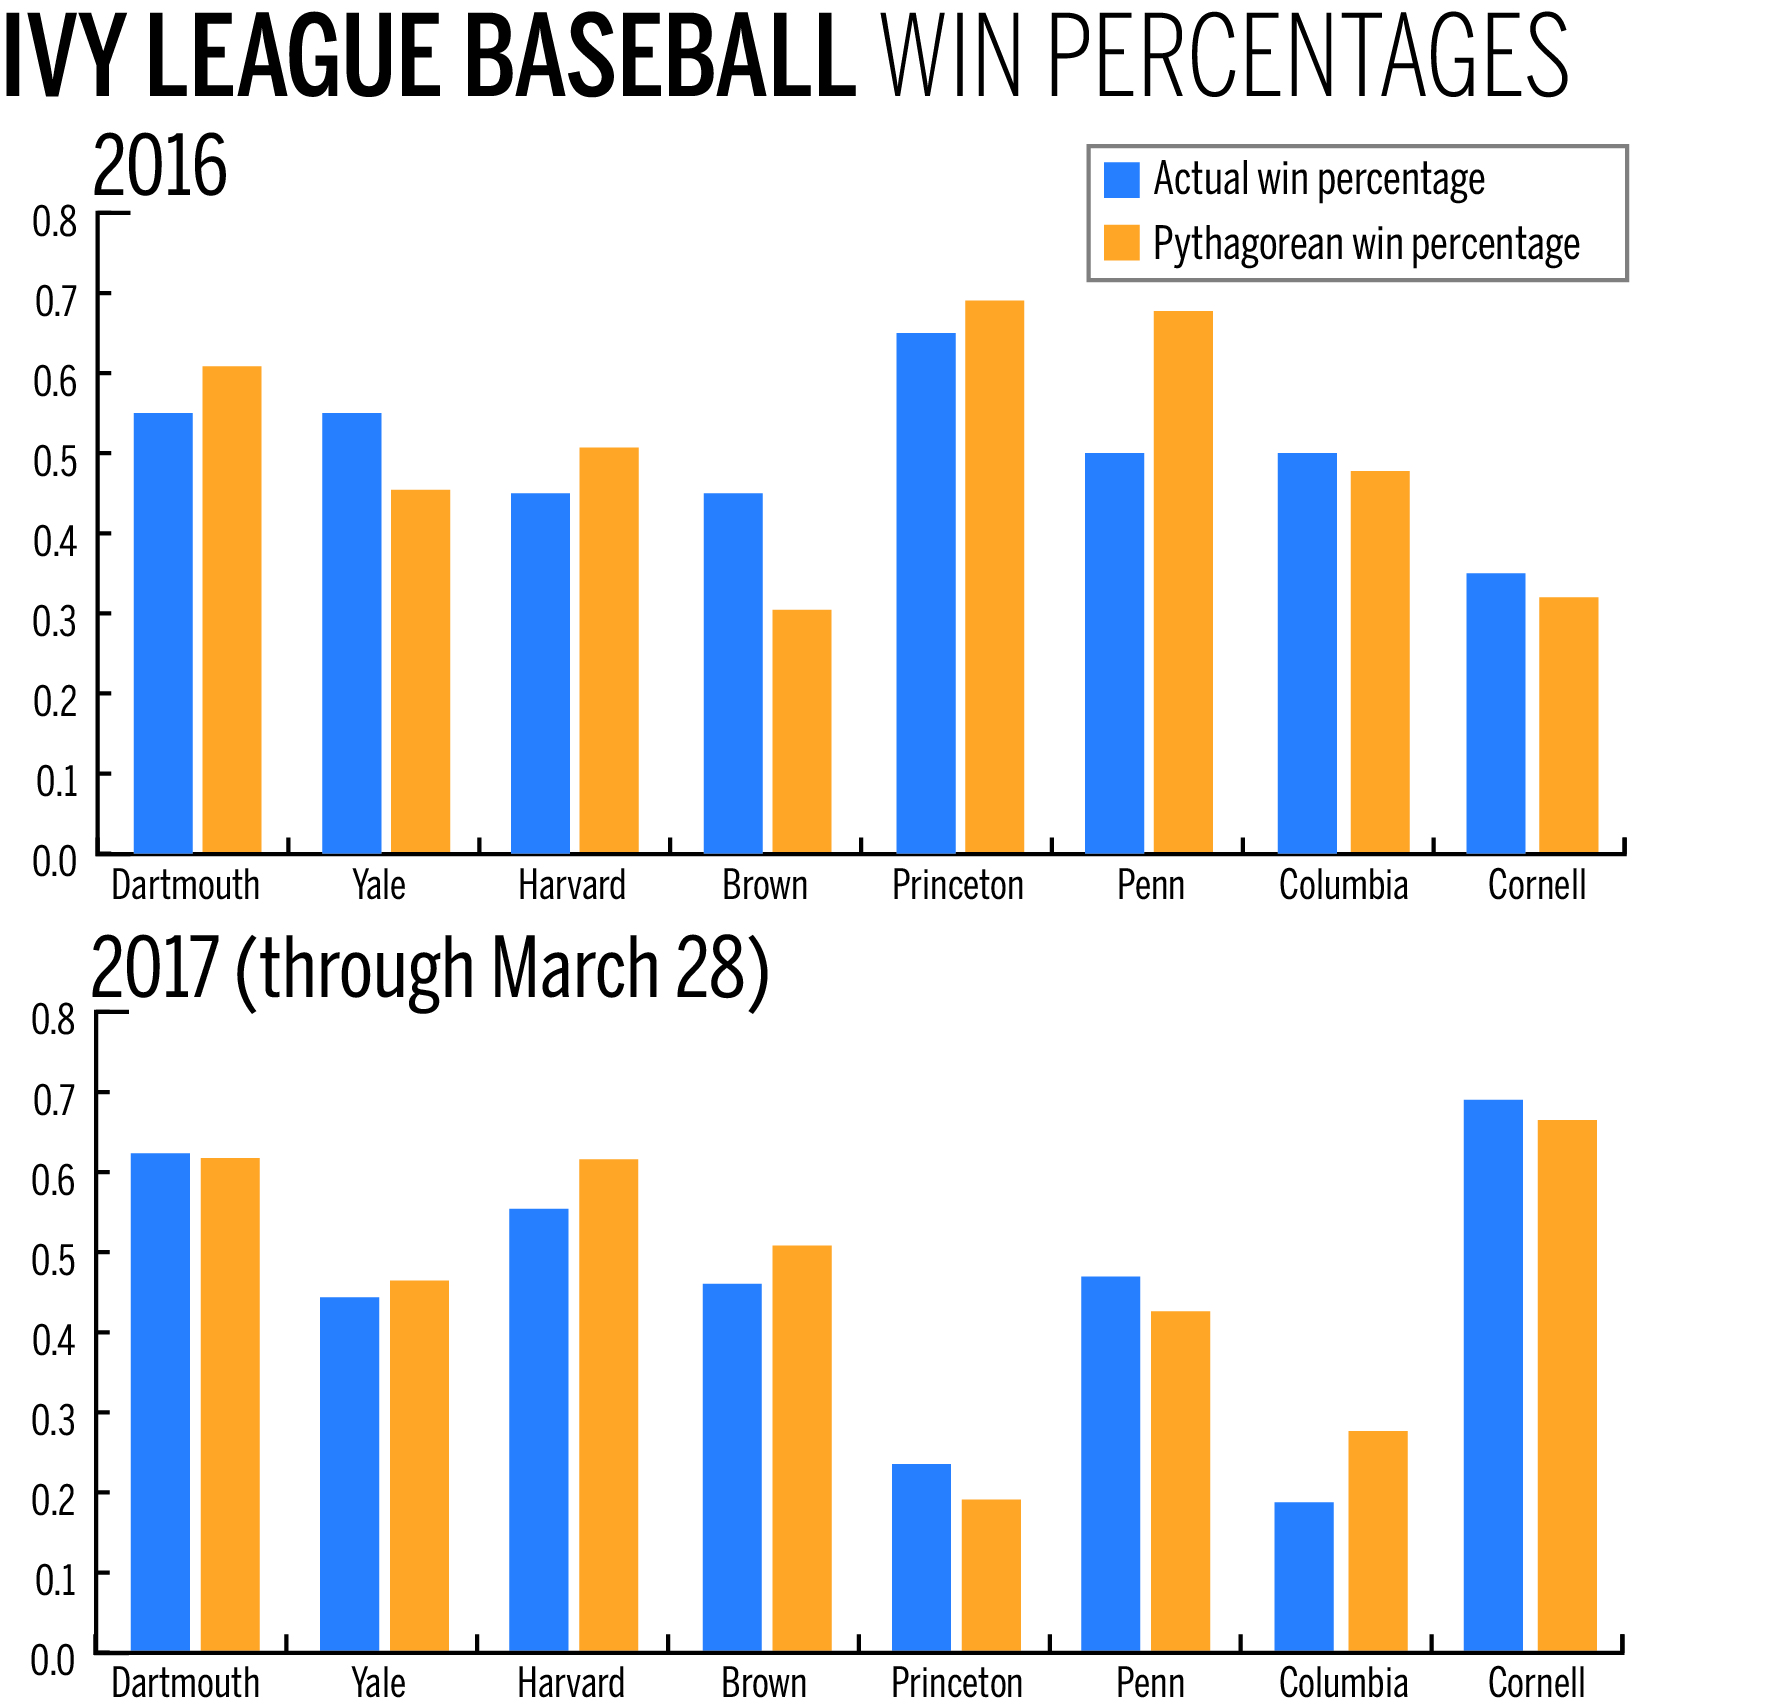
Baseball statistician Bill James developed a simple formula that does this by approximating what a team’s win percentage “should” be. The statistic, called Pythagorean win percentage, takes its name from the famous geometric theorem and divides the square of a team’s runs scored by the sum of the squares of the team’s runs scored and runs allowed. Looking at last year’s Ivy League standings and considering only each team’s 20 conference games, we can easily compute each team’s Pythagorean win percentage, displayed in the first chart.
We see in this chart that Yale outperformed its Pythagorean win percentage by nearly 10 percent. On the opposite end of the spectrum, the University of Pennsylvania underperformed its Pythagorean win percentage by a whopping 17.7 percent. This means that, based on their runs scored and allowed, Penn would have been expected to win nearly two more games than its 10–10 record in Ivy play.
Of course, this leads to an interesting debate: When a team, such as the 2016 Bulldogs, has a record better than the number of runs scored and allowed would suggest, is it due to luck or skill?
Some would argue that it is mostly luck. Given that baseball, in its most reductive form, requires teams try to score and prevent the opposition from scoring, the clustering of these runs is ostensibly a matter of random chance. For example, a team that, in a three-game series, won 10–0 and lost 2–1 and 3–2 may just have been unlucky that a few of the runs from the first game were not scored in the latter two games.
This argument has some statistical support, as sabermetricians have found Pythagorean records in Major League Baseball to be more predictive of future performance than actual records. Others, however, would argue that winning close games is a skill. The determiner of whether a team wins by a run or loses by a run is often decided by the ability to deliver a clutch hit or make a clutch out. Further arguments exist that certain types of teams, such as those with strong bullpens, are best suited for winning close games.
The above chart compares each Ivy League team’s Pythagoran and actual records in 2017.
What does the Bulldogs’ Pythagorean record say about them so far this year? Right now, not much that their actual record does not — their Pythagorean expectation is quite close to their actual record. In fact, most of the Ancient Eight teams’ estimated and actual records are quite similar.
The biggest discrepancy belongs to Brown, which has underperformed its Pythagorean win percentage by approximately 15 percent, perhaps suggesting that the Bears are a better team than their record would suggest. It is worth noting that not too much should be read into comparisons between teams’ records at this point in the season, due to differences in strength of schedule: Some Ivy teams have played better nonconference opponents than others, so they may have lower winning percentages as a result.
Yale’s conference schedule begins this weekend with doubleheaders at Princeton and Cornell.