


One of the special things about baseball is that every park is different. Not only might some fields have nicer dugouts or better amenities for fans, but the actual playing field also changes from park to park. Whereas in basketball the hoop is always 10 feet above the ground and in football the end zones are always 100 yards apart, in baseball, the distance of the center-field wall can vary tremendously. In Major League Baseball, many of the most famous stadiums have unique playing dimensions, from the Green Monster at Fenway to the Ivy-covered walls at Wrigley.
For statisticians, this poses an interesting problem: Hitting a certain number of home runs might not be as impressive in a small park as it is in a large park. Furthermore, more factors than outfield dimensions can affect a game. A turf infield might allow for hits to find holes that would otherwise be fielded. Less room in foul territory might let hitters extend their at bats rather than be retired on harmless pop-ups.
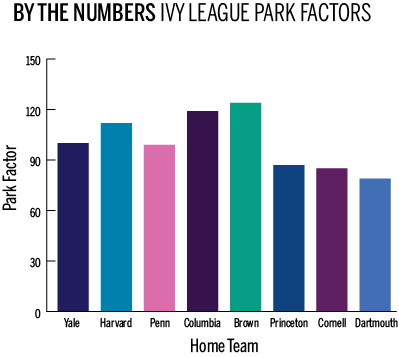
Large discrepancies in teams’ home fields exist in Ivy League baseball as well. Four Ancient Eight teams play home games on turf fields, while the other four have grass fields. Some parks, such as that of Columbia, are known for their shallow outfield fences. To measure this, we can calculate a statistic known as a park factor, which generates a single number indicating whether a park benefits pitchers or hitters. A park factor of 100 indicates an average park, with higher numbers indicating parks more favorable to hitters.
Calculating the park factor is not as simple as counting the number of runs scored in each park. Given that teams vary in the skill of their hitters, pitchers and fielders, we begin by comparing the number of runs scored and allowed at home by each team with the number scored and allowed on the road. After this, we make a series of adjustments to account for different opponents and the fact that the home team does not bat in the last half inning of most home wins. We calculated park factors for each Ivy team using eight years of data.
As can be seen, there is a wide range in ease of scoring runs throughout the Ivy League. Brown and Columbia’s home parks have park factors of around 120, indicating that it is approximately 20 percent easier to score runs there than in an average park. At the opposite end of the spectrum, Dartmouth has the most pitcher-friendly park, with a park factor of 79. Yale Field is almost exactly league average, with a park factor of 100.
Last year, some of the stats one would expect to be most impacted by a park’s dimensions demonstrated the substantial effect individual park factors can have. The two Ivy League teams with the most hitter-friendly parks — Columbia and Brown — took advantage of this. Of the 19 home runs the Lions hit in conference play, 14 came at home; of the 11 home runs Brown hit against Ivy opponents, eight came at home. While perhaps significant from game to game, park factor did not correlate to the 2016 final standings. Princeton and Cornell, the teams with the two lowest home park factors, went 13–7 and 7–13, respectively, in conference games last season.
Some of these trends seem to be emerging through the first eight games of the 2017 season. Ivy League teams have combined to slug 10 home runs in Providence, six more than at any other Ivy League park. While of course these numbers are also affected by which teams are playing, Yale Field currently sits last in the Ivy League in home run production, having only one home run hit at the Bulldogs’ friendly confines during the first four games.
This dearth of long-ball power in New Haven could also be attributed to the strength of Yale’s pitching staff this year. Bulldog hurlers own a conference-best 2.67 ERA and have allowed the fewest hits and runs of any Ivy League team. Of the 54 hits surrendered by Yale pitchers this season, none have left the yard.
Still, these numbers should be taken with a bit of caution. Whereas MLB teams play 81 home games in a single season, our entire data set has approximately half that many games per team. Moreover, teams might make small changes to their park that can make older data less relevant to now. However, the differences in parks were statistically significant, indicating they are unlikely to have arisen merely by chance.
When the Bulldogs continue their season next weekend at Harvard, their batters will have a slightly easier time as the Crimson’s home park yields approximately 10 percent more runs than the average field.