


In a game against Cornell last season, the Yale volleyball team lost the first set 25–11. The players and coaches surely knew that far better play was needed in order to come back and win the match against a Big Red team that had finished 3–11 in conference play the year before. The Bulldogs might not even have been surprised to learn that, based on Ivy League averages, the probability of Yale winning the match after a first-set loss of that margin was less than 14 percent. Nevertheless, Yale came back to defeat Cornell in five sets.
What those involved in the game may not have realized is that in the Ivy League, Yale and Cornell form the pair of teams most likely to produce such a comeback.
One of the important points of variance in sports is the level to which they separate events. For example, basketball is more or less continuous, football is divided into downs and tennis has a three-tiered system of points, games and sets. Volleyball falls closer to tennis, with each match following a first-to-three-sets format. As sets are, at least in regards to rules, identical, it stands to reason that the first set of a match provides a strong indicator as to how the rest of the match will unfold.
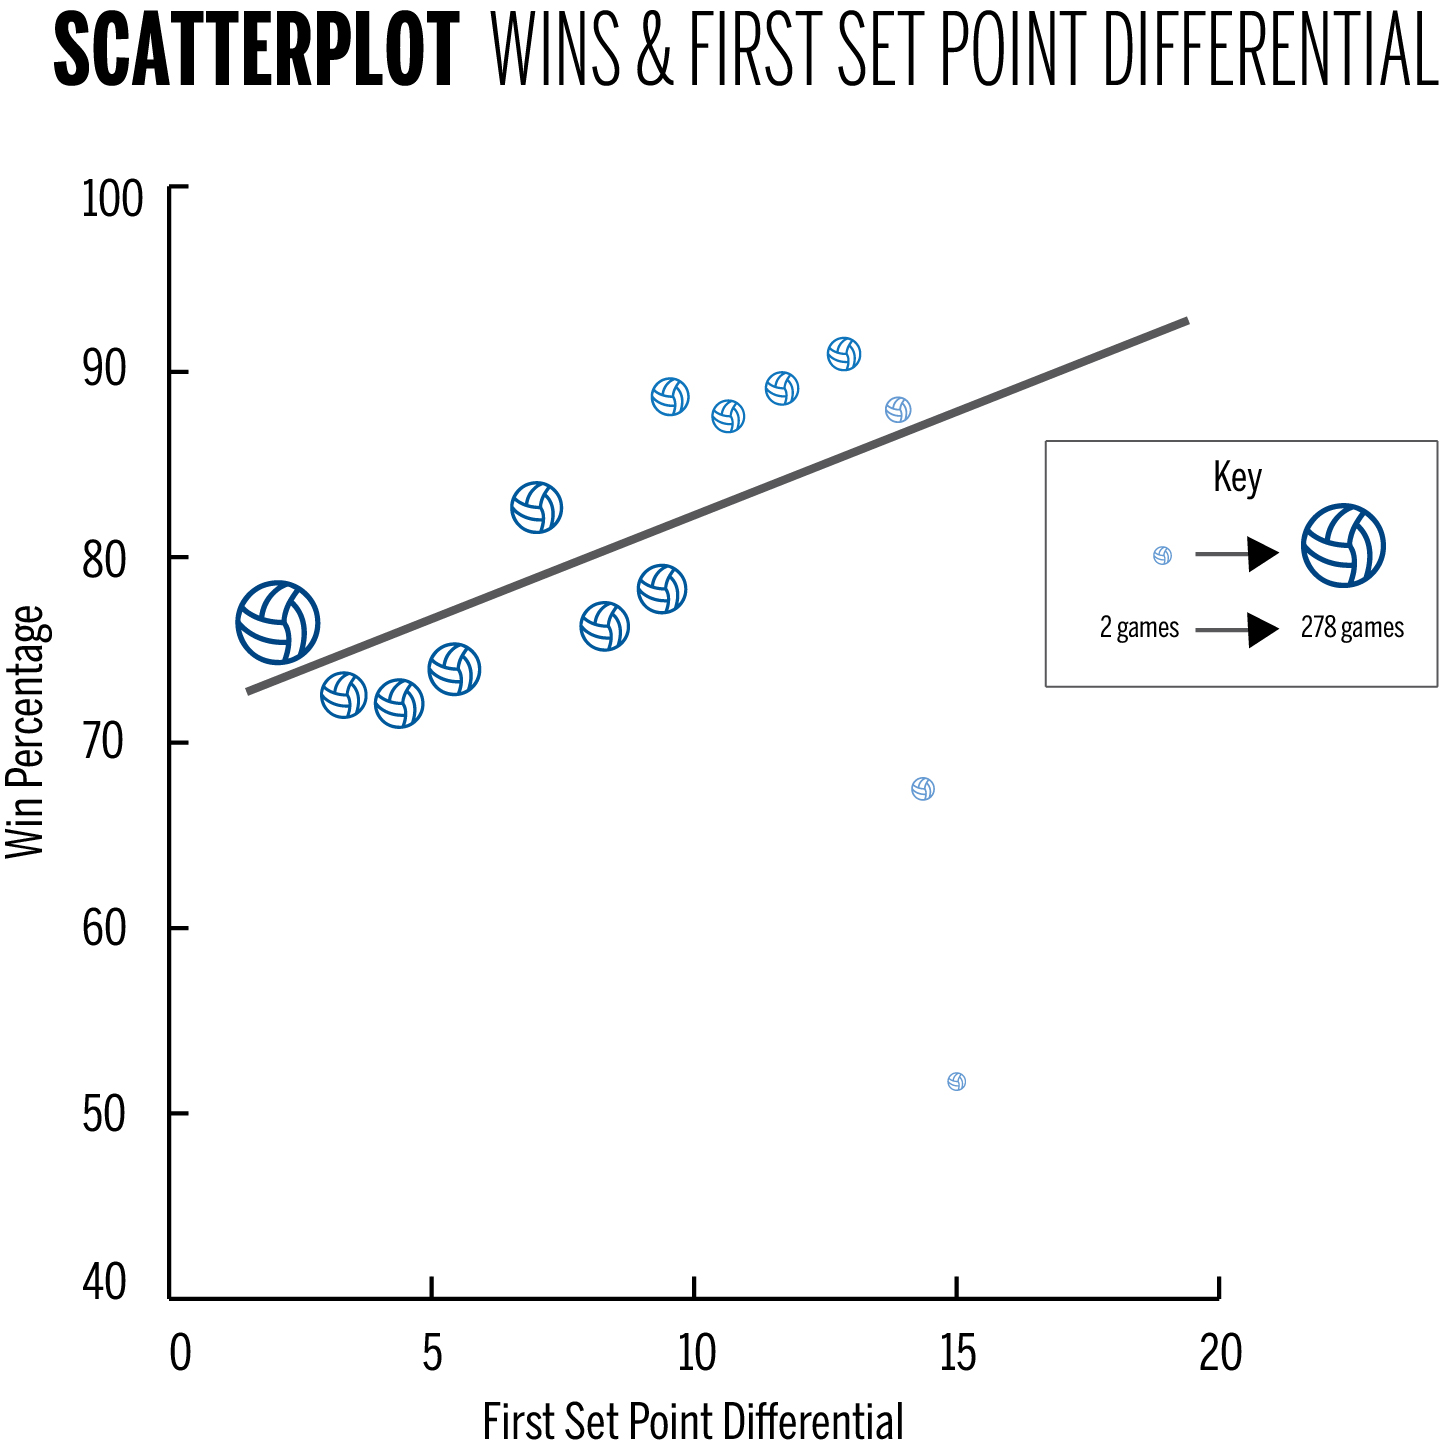
In 660 Ivy League volleyball matches played since the start of the 2012 season, the team that wins the first set went on to win the match 78.2 percent of the time. The margin of victory in the first set provides even more information. As could be expected, teams that win the first set by larger margins are more likely to triumph in the match. Using a weighted linear regression, we can fit a linear model for the probability that a team wins a match, given by how much they won the first set. The model shows an upward trend and a relatively high intercept, indicating that even given two evenly matched teams, there is a significant advantage to winning the first set. In the figure on page 12, the size of the circles represents the number of matches in which the first set was determined by a specific margin. The win percentage on the y-axis is the percentage of those matches that resulted in a win for the first-set winner.
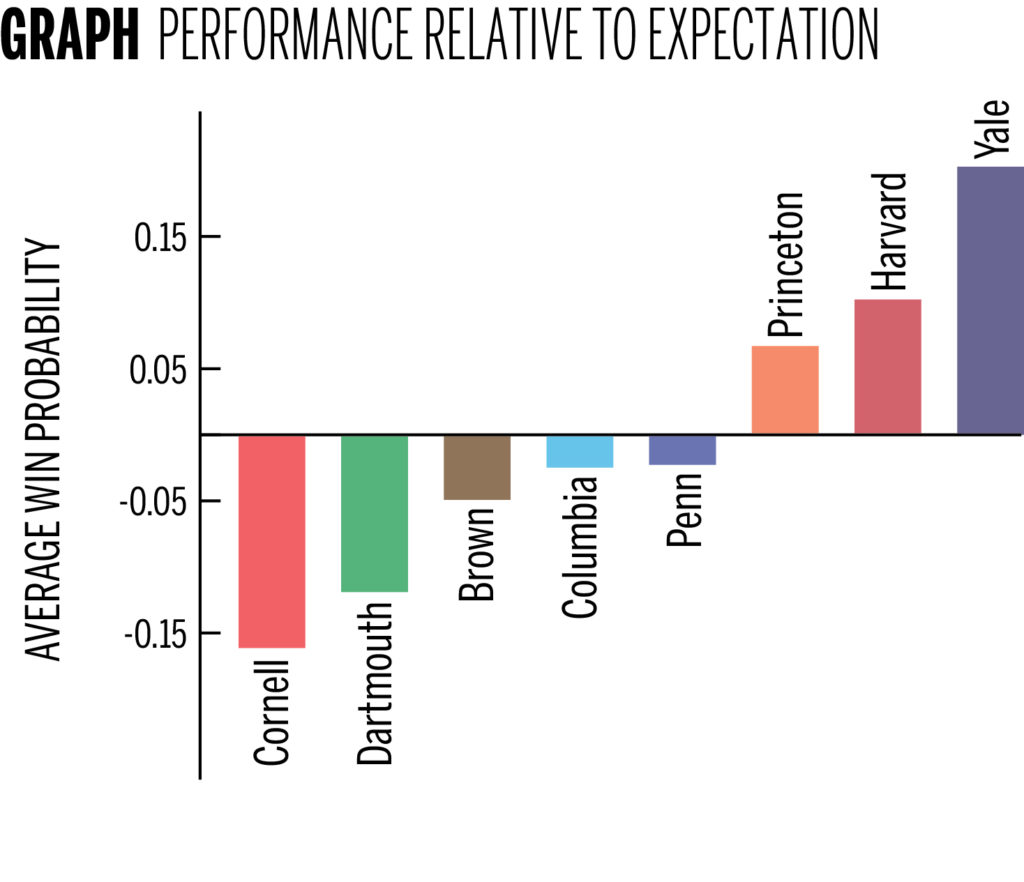
With a model in hand, we can now look at which Ivy League programs overperform and underperform relative to our predictions. For every game each team plays, our model predicts the probability of it winning after the first set has been played. Next, we look at the final outcome of the match and record the change in probability since the conclusion of the opening set. If, for example, a team has an 80 percent chance of winning after the first set — corresponding to an eight-point margin of victory — and then goes on to lose the match, the change in probability is negative 0.80. If they go on to win, then the change in probability is positive 0.20. A team that wins more often than the model predicts will have a positive average change in probability over all its matches, and vice-versa for a team that loses more often than expected. The chart above shows the average change in probability for all Ivy League teams over the past five seasons.
One important caveat here is that a large part of these deviations can be attributed to regression to the mean. Said another way, Cornell has been a poor team, and Yale has been a good team over the last several years. We expect that a good team will come back often and that a bad team will blow leads. As such, it is not surprising that ordering teams by average change in probability nearly matches ordering them by record. Nevertheless, this relationship is true in the other direction as well, as teams that are “clutch” will end up having better records.
The greatest deviations from the model are Yale in the positive and Cornell in the negative. This indicates that the Yale team tends to start slow relative to what would be expected of a team that wins as often. Cornell has exactly the opposite story. If, in the case of Yale’s comeback against Cornell on Oct. 3 of last year, we account for the average deviations of the two teams from our model, Yale’s probability of victory after the first-set loss jumps from less than 14 percent to nearly 50 percent.
Yale’s eventual victory in five sets, then, is perhaps not as surprising as it appeared at first glance.
Michael Menz is a member of the Yale Undergraduate Sports Analytics Group. Contact the group at yalesportsanalytics@gmail.com .